Are you using docker compose? You can set the container hostname for telegraf, https://community.influxdata.com/t/incorrect-hostname-picked-up-by-telegraf-docker-container/24469/6
this post was submitted on 13 Sep 2023
10 points (91.7% liked)
Selfhosted
37811 readers
524 users here now
A place to share alternatives to popular online services that can be self-hosted without giving up privacy or locking you into a service you don't control.
Rules:
-
Be civil: we're here to support and learn from one another. Insults won't be tolerated. Flame wars are frowned upon.
-
No spam posting.
-
Posts have to be centered around self-hosting. There are other communities for discussing hardware or home computing. If it's not obvious why your post topic revolves around selfhosting, please include details to make it clear.
-
Don't duplicate the full text of your blog or github here. Just post the link for folks to click.
-
Submission headline should match the article title (don’t cherry-pick information from the title to fit your agenda).
-
No trolling.
Resources:
- awesome-selfhosted software
- awesome-sysadmin resources
- Self-Hosted Podcast from Jupiter Broadcasting
Any issues on the community? Report it using the report flag.
Questions? DM the mods!
founded 1 year ago
MODERATORS
Yes I am. I now chose to just change it in the config, restarted telegraf and it works now. Thanks :)
With Prometheus I would add a section to the scrap config to rewrite the labels attached to each metric. Does such a thing exist for telegraf? I've never used it.
Or could you change the grafana query to just aggregate the values for all pods in that deployment?
Thanks for answering so fast! :)
I'm not deep enough to know if telegraf can do this. It has "plugins" that work okayish. Not a lot to configure. I suppose I could start going into the nitty gritty but I would abolutely love to avoid it. I have like 10+ services running on my server and I can't go this deep without an IT team and with a job. :)
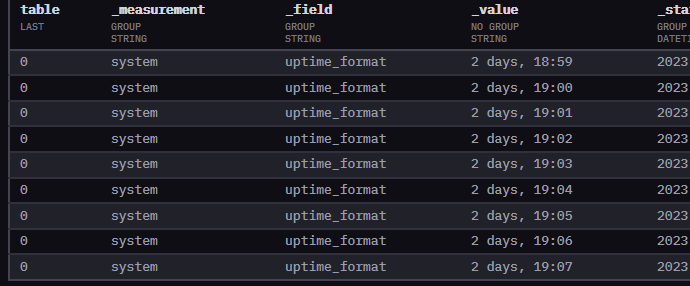
In this special case, it is uptime I'm after and influxdb throws a table at me that looks like this:
then I use this to get the data into grafana:
from(bucket: "telegraf")
  |> range(start: v.timeRangeStart, stop: v.timeRangeStop)
  |> filter(fn: (r) => r["_measurement"] == "system")
  |> filter(fn: (r) => r["_field"] == "uptime_format")
  |> aggregateWindow(every: v.windowPeriod, fn: last, createEmpty: false)
  |> yield(name: "last")
And what turns up is this:
Now, having worked with SQL before, there is a way to just show the "2 days, 18:02" bit instead of two values and without manually selecting the host each time in SQL, I just don't know how to do it in flux.
I hope this makes sense. Have a good one. :)
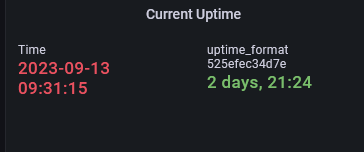
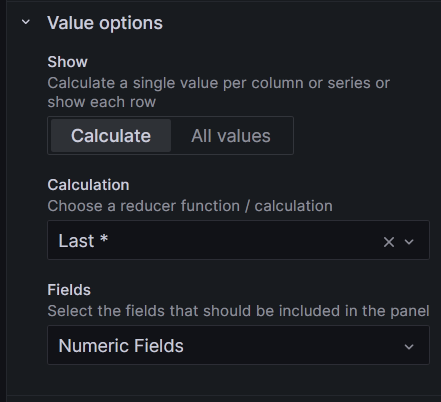
You don't do it in flux, you do it in the panel options in Grafana.
On your original question you can set the Telegraf hostname in the config, for docker stuff I just use omit_hostname = true
Okay! Thanks for explaining! Thats very helpful.